Analysis of 3D colocalization
Measure of the colocalization in fluorescence microscopy images
The colocalization is an important tool for cell biologists. This information allows to measure the promiscuity between two fluorescent molecules in the cell. Numerous methods measure this information by comparing the images of both molecules.

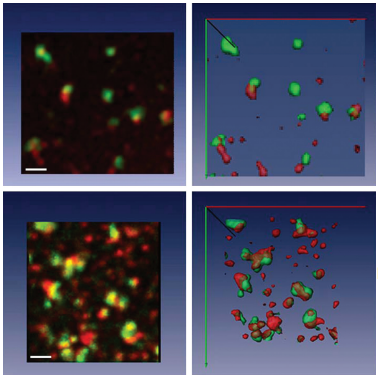
In the above example, both fluorescent stainings to the left and in the middle show a similar pattern of location. The image of overlay (to the right) is little informative as for the colocalization of both markers. An analysis of colocalization by segmentation leads to obtain this quantification. A wavelet segmentation is applied to every channel to detect the fluorescent objects. This segmentation is made in 3D to increase precision. The measure of colocalization is defined as the ratio of pixels segmented in both channels. While the analysis of the left images and the center images gives a feeling of an important level of colocalization, the quantitative analysis reveals a very low level (5,6 %). The quantitative analysis thus allows to avoid the important errors of the visual interpretation.

The following illustration highlights the importance of making analyses in 3D rather than of analyzing the 2D projections.
References
The Cellular Pathway of CD1e in Immature and Maturing Dendritic Cells. C Angénieux, VFraisier, B Maître, V Racine, N van der Wel, D Fricker, F Proamer, M Sachse, JP Cazenave, P Peters, B Goud, D Hanau, JB Sibarita, J Salamero and H de la Salle. Traffic 2005; 6: 286–302
Interested in softwares or services?

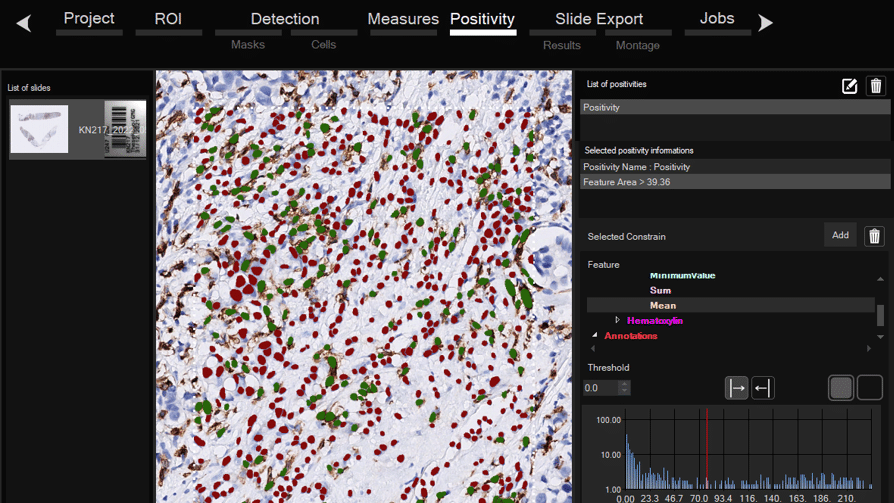
Software for histological samples and TMA
Automatically detects and quantifies your histological slides easily, without requiring bioinformatics expertise. IHC/Fluorescence/Deep learning

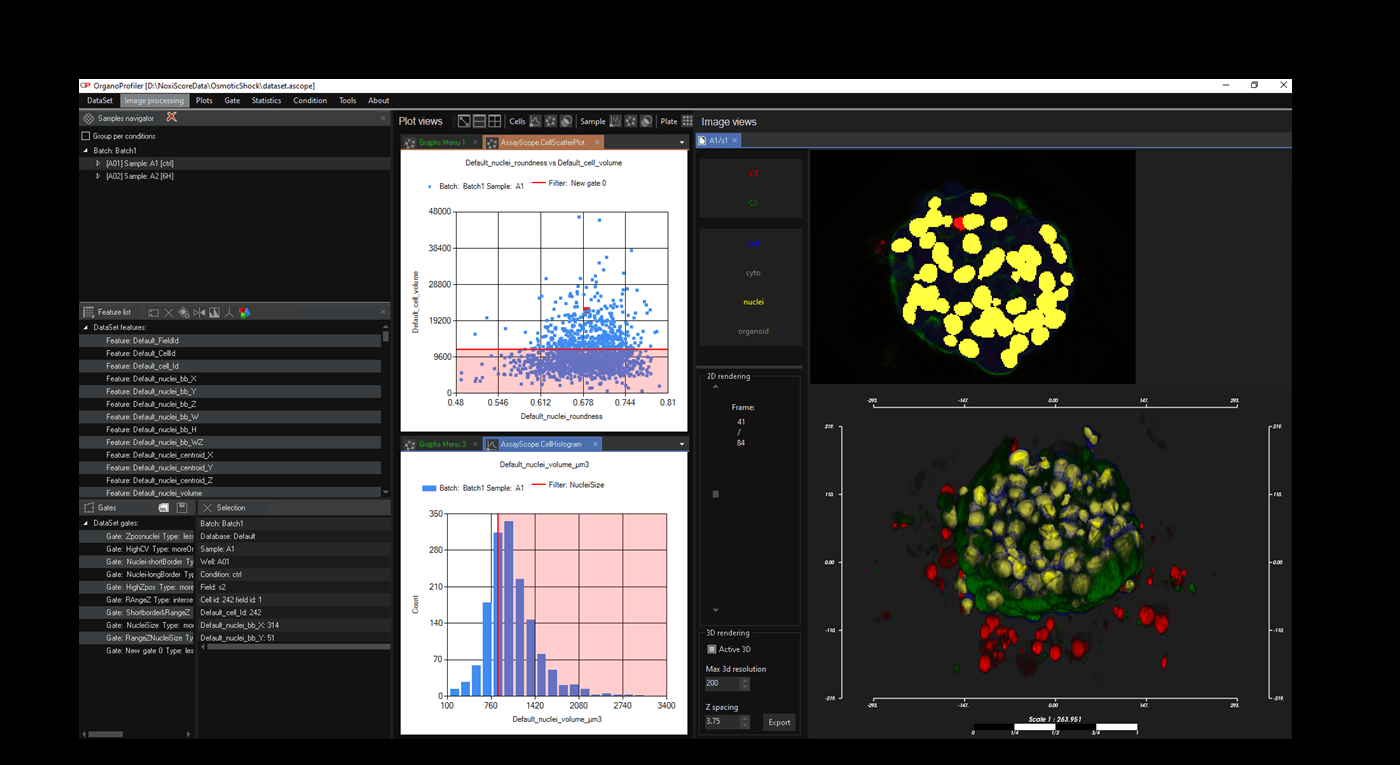
Software for organoid, spheroid and 3D cell culture and tissue
Automatic 3D segmentation and high-content screening analysis software to navigate your assays and monitor drug effects

Services of analysis and characterization
- Image analysis in patients studies
- Characterization of drug/compounds effects
- Automatic detection of rare events

Software development for biomedical imaging
- Customized software solutions with ergonomics UIX
- AI for automatic analysis
- Industrialization of analyses in laboratories
Registered address
73 Allée Kléber,
34000 Montpellier, France
Laboratory (in Montpellier’s IHU)
300 av. du Pr Emile Jeanbrau 34090 Montpellier, France
Contact
+33 (0) 9 83 33 81 90