Detection of tissue structures
Automatic recognition of tissues and their structures
Tissue analysis needs a stage of segmentation which consists in separating the various tissular structures. In the following example, a segmentation is applied to small intestine section. The original image is separated in 3 classes. The white class represents the area of low cellular density, the area in dark gray corresponds to the villosities and area in light gray corresponds to the connective tissue.

Cellular analysis in specific tissues
Once tissue structures were correctly defined, cells are individually segmented. The color of the outlines of every cell (cytoplasm in dark and nuclei in light) determines its class

Quantitative parameters obtained by crossing of cellular and tissular information
This quantification allows to :
- Measure the quantity of connective tissue and the villosities
- Count cell number in every tissue structure
- Mesure cell morphology
- Mesure villosity morphologies
- Mesure biomarker intensities in different tissue structures
Interested in softwares or services?

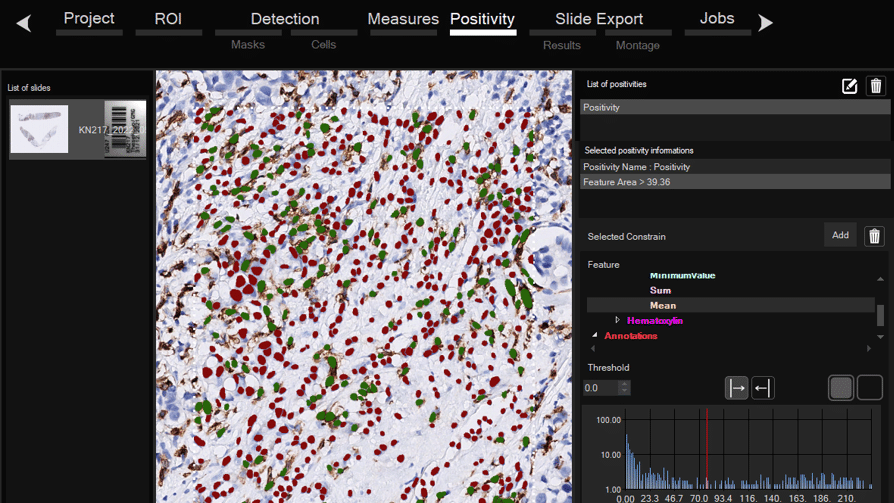
Software for histological samples and TMA
Automatically detects and quantifies your histological slides easily, without requiring bioinformatics expertise. IHC/Fluorescence/Deep learning

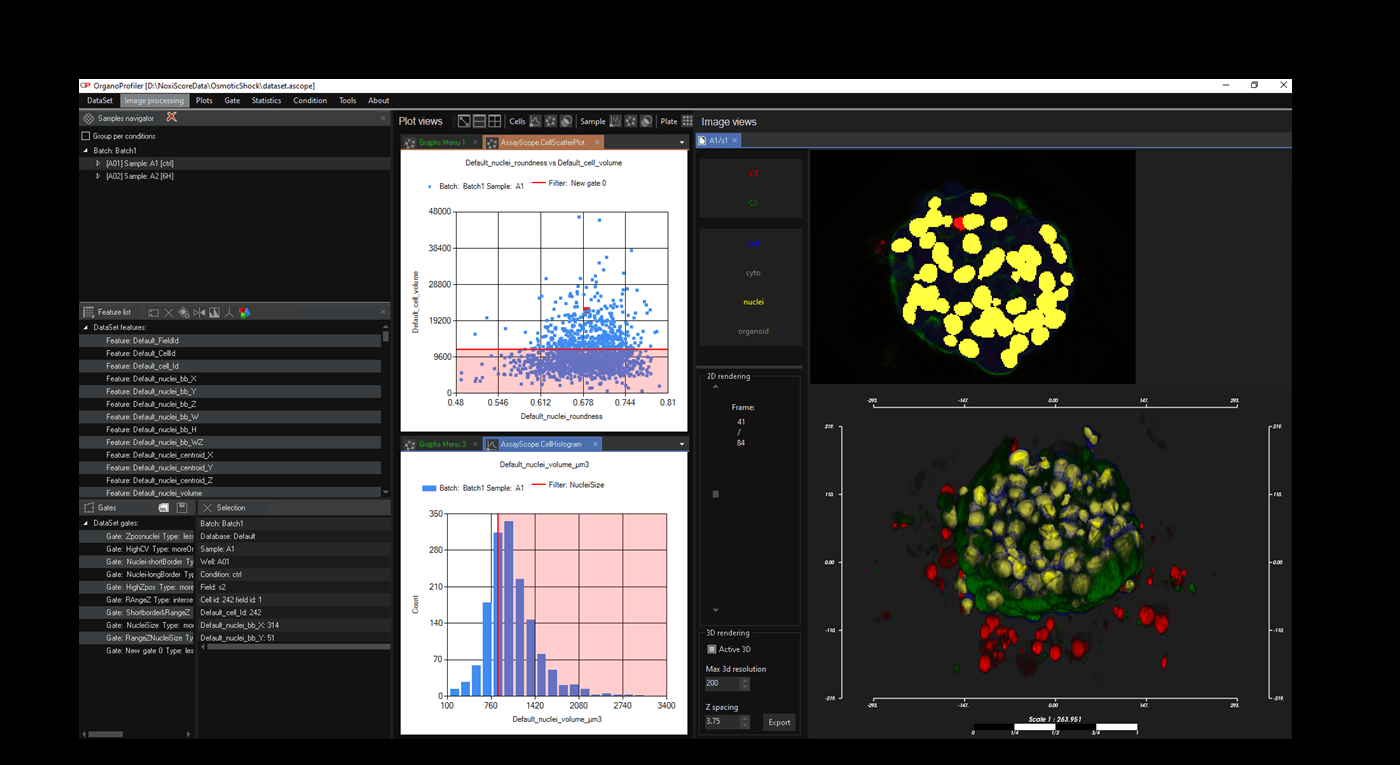
Software for organoid, spheroid and 3D cell culture and tissue
Automatic 3D segmentation and high-content screening analysis software to navigate your assays and monitor drug effects

Services of analysis and characterization
- Image analysis in patients studies
- Characterization of drug/compounds effects
- Automatic detection of rare events

Software development for biomedical imaging
- Customized software solutions with ergonomics UIX
- AI for automatic analysis
- Industrialization of analyses in laboratories
QuantaCell, Hôpital Saint Eloi, IRMB
Contact
+33 (0) 9 83 33 81 90
80 av Augustin Fliche
34090 Montpellier, France