Time-lapse tracking of organelles
Spatio-temporal analysis of the cell compartments
The measurement of the dynamics of cell compartments is essential to the understanding of their mechanisms. It goes through the acquisition fast 2D or 3D images to be compatible with object tracking in time. The trackSpatio-temporal analysis of the cell compartments
The measurement of the dynamics of cell compartments is essential to the understanding of their mechanisms. It goes through the acquisition fast 2D or 3D images to be compatible with object tracking in time. The tracked objects can be for example:
- Vesicles in membrane trafficking
- Adhesion sites
- Kinetochores, centrioles & MTOC
- Mitochondria
- Polymerization sites on microtubules
- Single molecules (qDots, PALM/STORM)
Information obtained by the dynamic quantification are:
The measures extracted from object tracking are:
- The instantaneous and mean speeds
- Diffusion coefficients, in particular for the single molecules (SPT)
- The localization of departure and arrival compartments (ER, Golgi, plasmic membrane…)
- The centrifugal or centripetal direction
Examples of dynamic analysis of the membrane trafficking
Vesicles stained with LAR-PTP
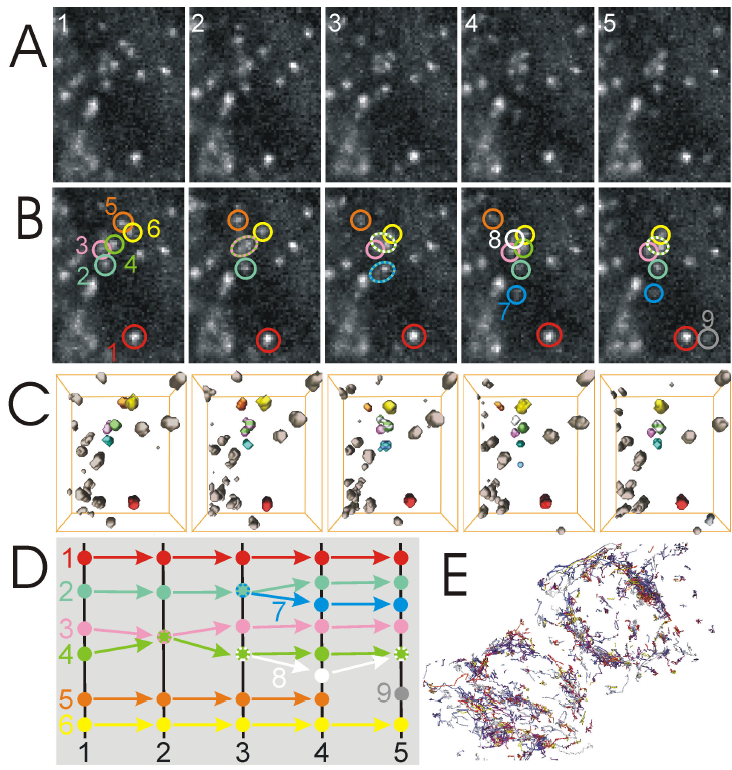
The following figure illustrates the tracking of a fluorescent protein LAR-PTP in video-microscopy 3D+t (A). Every vesicle is detected at first in 3D then tracked over time (B). This tracking is represented by the circles of colors centered on vesicles. Some vesicles merge with others (circles dotted lines). (C) represents vesicles in 3D. (D) diagram of association process of objects detected over time. (E) complete trajectories are represented as 3D lines.
In this partial video, all vesicles are tracked over time and instantaneous speeds are calculated
References
V Racine, A Hertzog , J Jouanneau , J Salamero, C Kervrann and JB Sibarita Multiple-target tracking of 3D fluorescent objects based on simulated annealing, IEEE, ISBI 2006.
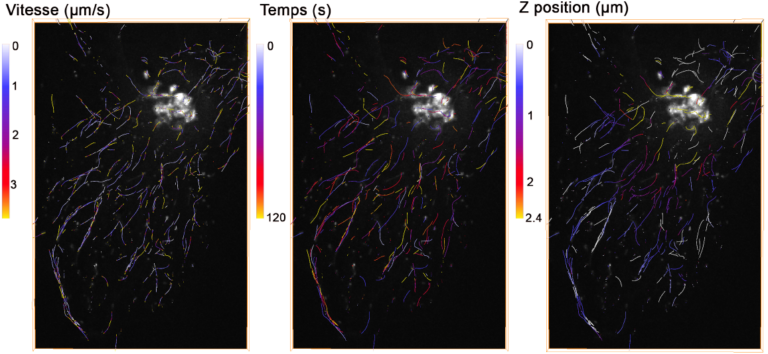
In this other application, vesicles tagged by Rab6a’-GFP are traced over time using a 3D deconvolution based video-microscope. The figure represents 3D trajectories of vesicles by superimposing of fluorescence image. The color coding of trajectories is made according to the instantaneous speed, Z position or temporal coordinate.
References
V Racine, M Sachse, J Salamero, V Fraisier, A Trubuil and JB Sibarita. Visualization and quantification of vesicle trafficking on a 3D cytoskeleton network in living cells. Journal of Microscopy, 2007.
Interested in softwares or services?
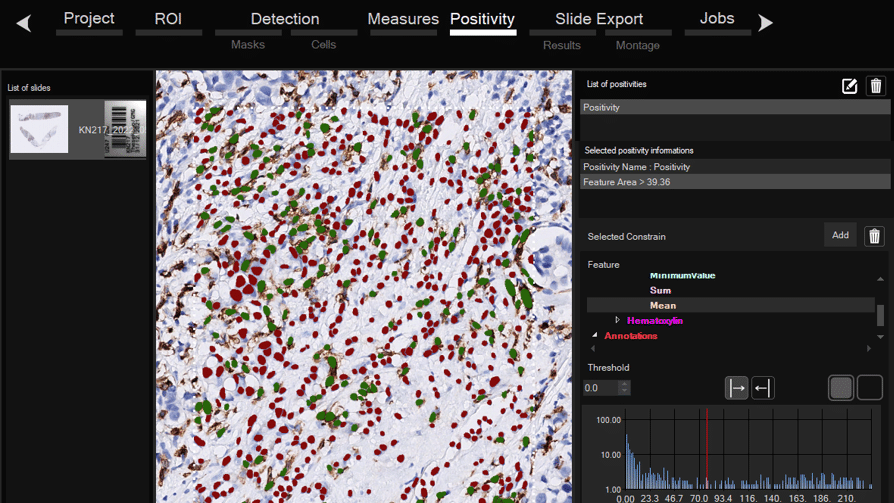
Software for histological samples and TMA
Automatically detects and quantifies your histological slides easily, without requiring bioinformatics expertise. IHC/Fluorescence/Deep learning
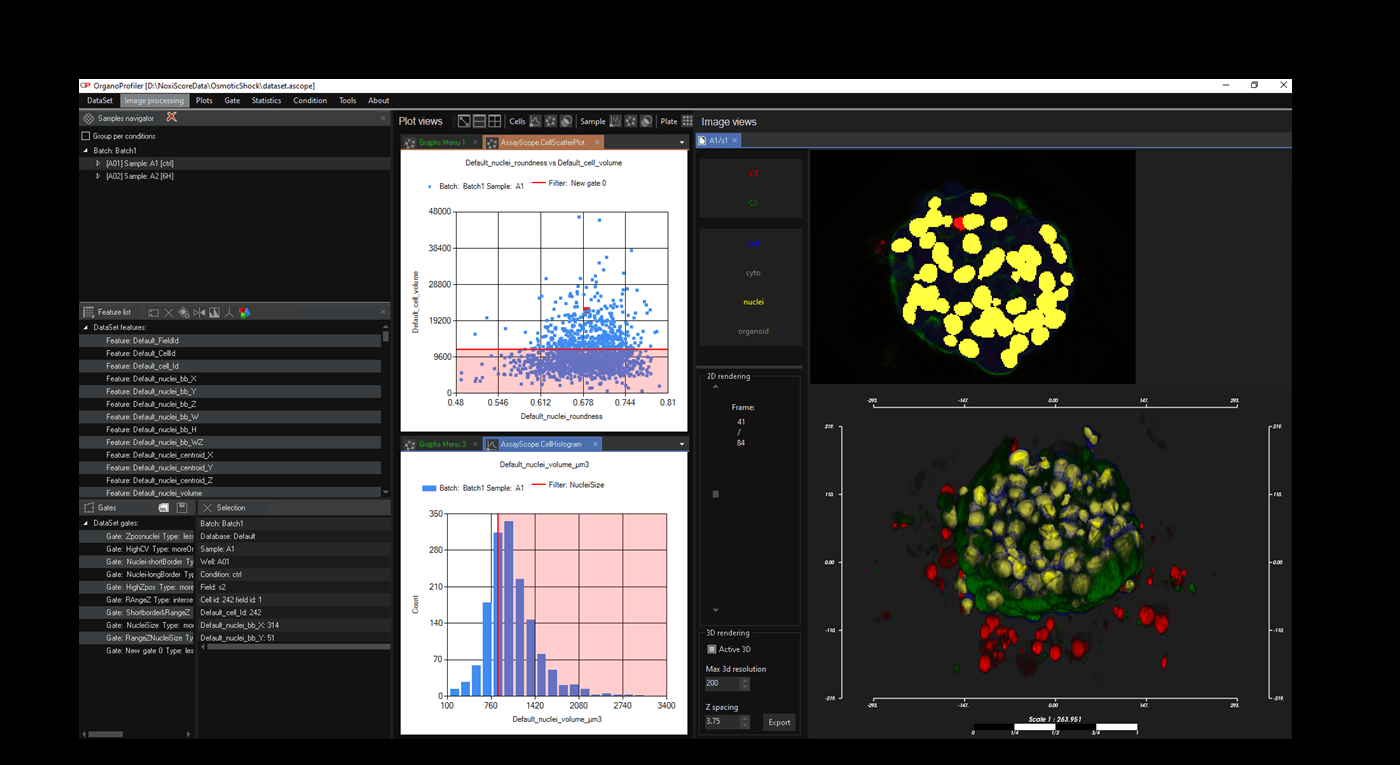
Software for organoid, spheroid and 3D cell culture and tissue
Automatic 3D segmentation and high-content screening analysis software to navigate your assays and monitor drug effects
Services of analysis and characterization
- Image analysis in patients studies
- Characterization of drug/compounds effects
- Automatic detection of rare events

Software development for biomedical imaging
- Customized software solutions with ergonomics UIX
- AI for automatic analysis
- Industrialization of analyses in laboratories
QuantaCell, Campus Balard, IHU
Contact
+33 (0) 9 83 33 81 90
300 av. du Pr Emile Jeanbrau
34090 Montpellier, France